
In the province of Ninh Thuan, Vietnam, there stands a number of wind farms, with several more in planning. If you were to take a trip there in January and I would bet you all the money I have in my wallet that it’ll be a breezy day. Go there in July however and I can guarantee you will be sweating in the still heat of the day, staring at stationary wind turbines. The region has a highly seasonal wind regime. In winter, the prevailing north-easterly winds roar through a funnel in the mountains providing a real threat to any loose-fitting hat. In summer, those same mountains become windbreaks to the season’s south westerlies, sheltering the area into stillness.
Ninh Thuan is a particularly extreme example, but in the tropical markets we serve we have time and again seen the impact of monsoonal seasonality on wind regimes. Some months the wind blows, and it will blow with remarkable consistency. In other months there will be nothing.
As wind engineers, we are taught that wind frequency distributions follow nice neat “Weibull” distributions, smoothly centred around a mean wind speed. But is that really true, and what’s the consequence when it’s not?
Frequency distributions and its relationship with the IEC standards…
A probability density function is used to statistically represent the frequency of wind speeds for a wind farm. This frequency distribution is often represented in the form of either Rayleigh or Weibull distribution, most importantly in IEC 61400-1, an international standard for wind turbine design published by the International Electrotechnical Commission (IEC). The standards described in IEC 61400-1 form a set of design requirements to validate wind turbines against, to ensure that a wind turbine can survive the wind conditions experienced during its lifetime.
IEC 61400-1 defines three major wind turbine classes, and describes wind speed frequency distributions to help in determining individual load cases for normal design conditions. IEC 61400-1 assumes mean value of wind speed over 10-minute time intervals follow a Rayleigh distribution at the hub height of a wind turbine.
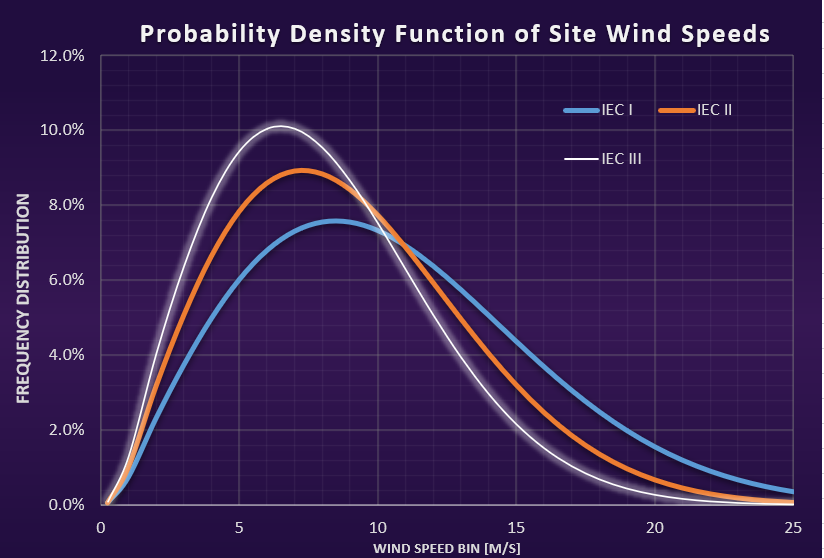
Figure 1: Frequency distribution for the three classes as specified by IEC
Do the site measurements actually match the IEC standards?
For many sites in Europe and other mid-latitude sites which are dominated by frequent frontal weather systems, the approximation is typically quite good. What about in the tropics, where trade-winds and monsoons drive wind regimes?
Below are frequency distributions of actual measurements from sites across Southeast Asia. For each plot we have scaled measured wind speeds to a mean of 7.5m/s, so they’re comparable with IEC class III.
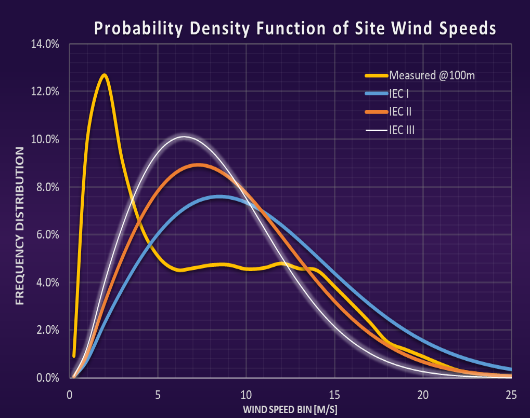 Figure 2: Frequency distribution at Site A
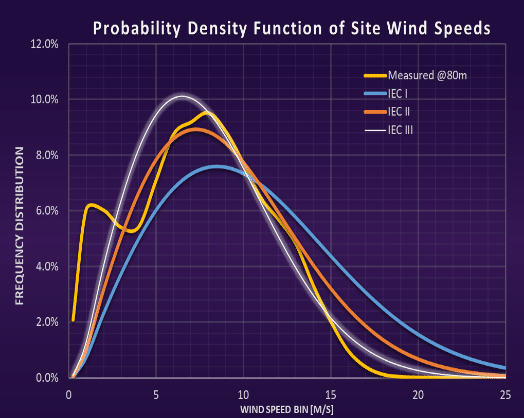 Figure 3: Frequency distribution at Site B
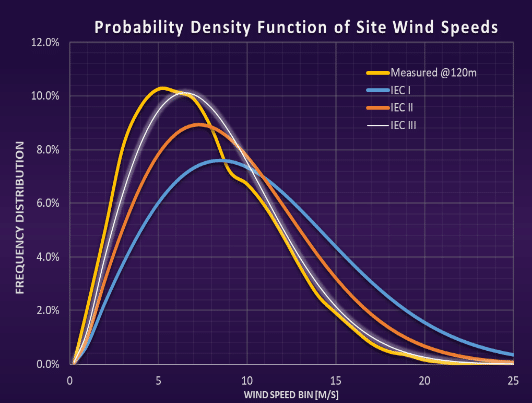
Figure 4: Frequency distribution at Site C
Sites A and B have two distinct parts to the frequency distribution. These represent two wind seasons which can be classified as a low-wind and high-wind season. These are typical of monsoonal wind regimes with strong seasonal variations. Large-scale climate systems such as El Niño and La Niña phenomena can also be important players in influencing the shape of wind patterns.
Site C, meanwhile, has a frequency distribution concentrated at medium wind speeds, typical of a site within a trade winds belt. This means there will be more wind energy in the cubic part of the power curve, but with very few high winds.
These frequency distributions of actual measurements clearly do not match the simplified IEC wind classes.
What does this mean for wind farm developers?
Frequency distribution is one of the important design criteria for a wind turbine in a wind farm, so how can a developer know whether a turbine will be suitable for a site when the frequency distributions are so inconsistent with the design standard?
Currently, they can’t. The big challenge lies in understanding the load calculations for a particular turbine on a particular site:
- What are the simulated wind speeds used in the iteration for analysing loads?
- What is the bending moment calculated for the wind turbine components?
- What are the stresses computed for the wind turbine components?
- What is the damage equivalent loads factor (DEL) assumed?
- What is the value used for DEL margin?
These are all the domain of a site-specific load’s assessment, which requires a weeks of effort and is typically undertaken by the OEM, sometimes only after a developer has committed to a turbine type for their project. For developers a big challenge is to decipher the deviation in wind turbine loads when the frequency distribution of site wind speeds differs from a specific class that a wind turbine has been initially designed for. Getting it wrong means effort wasted designing a project for the wrong machine.
Possible way forward…
So how could the situation be improved? Developers clearly need additional basic information as to whether a turbine will be suitable for their site, and information helps everyone. If a benign frequency distribution allows for a Class III turbine to be put on a site with Class II average wind speeds, project viability will take a huge step for the better. Everyone will win, not least the turbine supplier.
In an ideal world, instead of a single, Weibull curve, what if a range of varying acceptable distributions was provided for a turbine type? Developers could match their site frequency distribution to a much closer approximation and could make more informed decisions accordingly in the design of their projects. Without that information, inevitably conservative assumptions are made, and opportunities go begging.
As the wind industry reaches new markets, with new wind regimes, and with increasingly sophisticated developers, it is time to ditch using a single Weibull curve and accept that the real world is a lot more complex.
Vishal Murali

Here is Vishal, he plays the role of a Wind Engineer. He believes that adaptability and curiosity are two important traits to have for an individual and loves to learn new concepts in the field of renewable energy. He likes to socialise and understand different cultures across the globe. In his free time, he plays club cricket in Bangalore and doodles on the internet on economics and history. You can have a discussion with him on sports, politics, wind energy, economics, history etc…. Well, anything!